Performance Overview
Snapshot of our travel performance indicators
Traveler Satisfaction
On-Time Performance
Average Rating
Repeat Customers
Performance Trends
Visual representation of our key performance indicators
Monthly Traveler Satisfaction
Destination Popularity
Booking Conversion Rate
Customer Demographics
Destination Performance
How our destinations are performing across key metrics
| Destination | Satisfaction | On-Time % | Avg. Rating | Repeat % | Trend |
|---|---|---|---|---|---|
 Italy
Italy
|
96% | 92% | 4.8 | 88% |
2.1%
|
 Japan
Japan
|
95% | 94% | 4.9 | 90% |
3.4%
|
 Kenya
Kenya
|
99% | 98% | 4.9 | 95% |
1.7%
|
 Peru
Peru
|
91% | 85% | 4.5 | 70% |
0.0%
|
 Thailand
|
90% | 87% | 4.4 | 78% |
1.2%
|
Recent Customer Feedback
What our travelers are saying about their experiences
"The trip to Japan was perfectly organized. Every detail was taken care of, and the guides were incredibly knowledgeable. EdgeWay made our first visit to Asia completely stress-free."

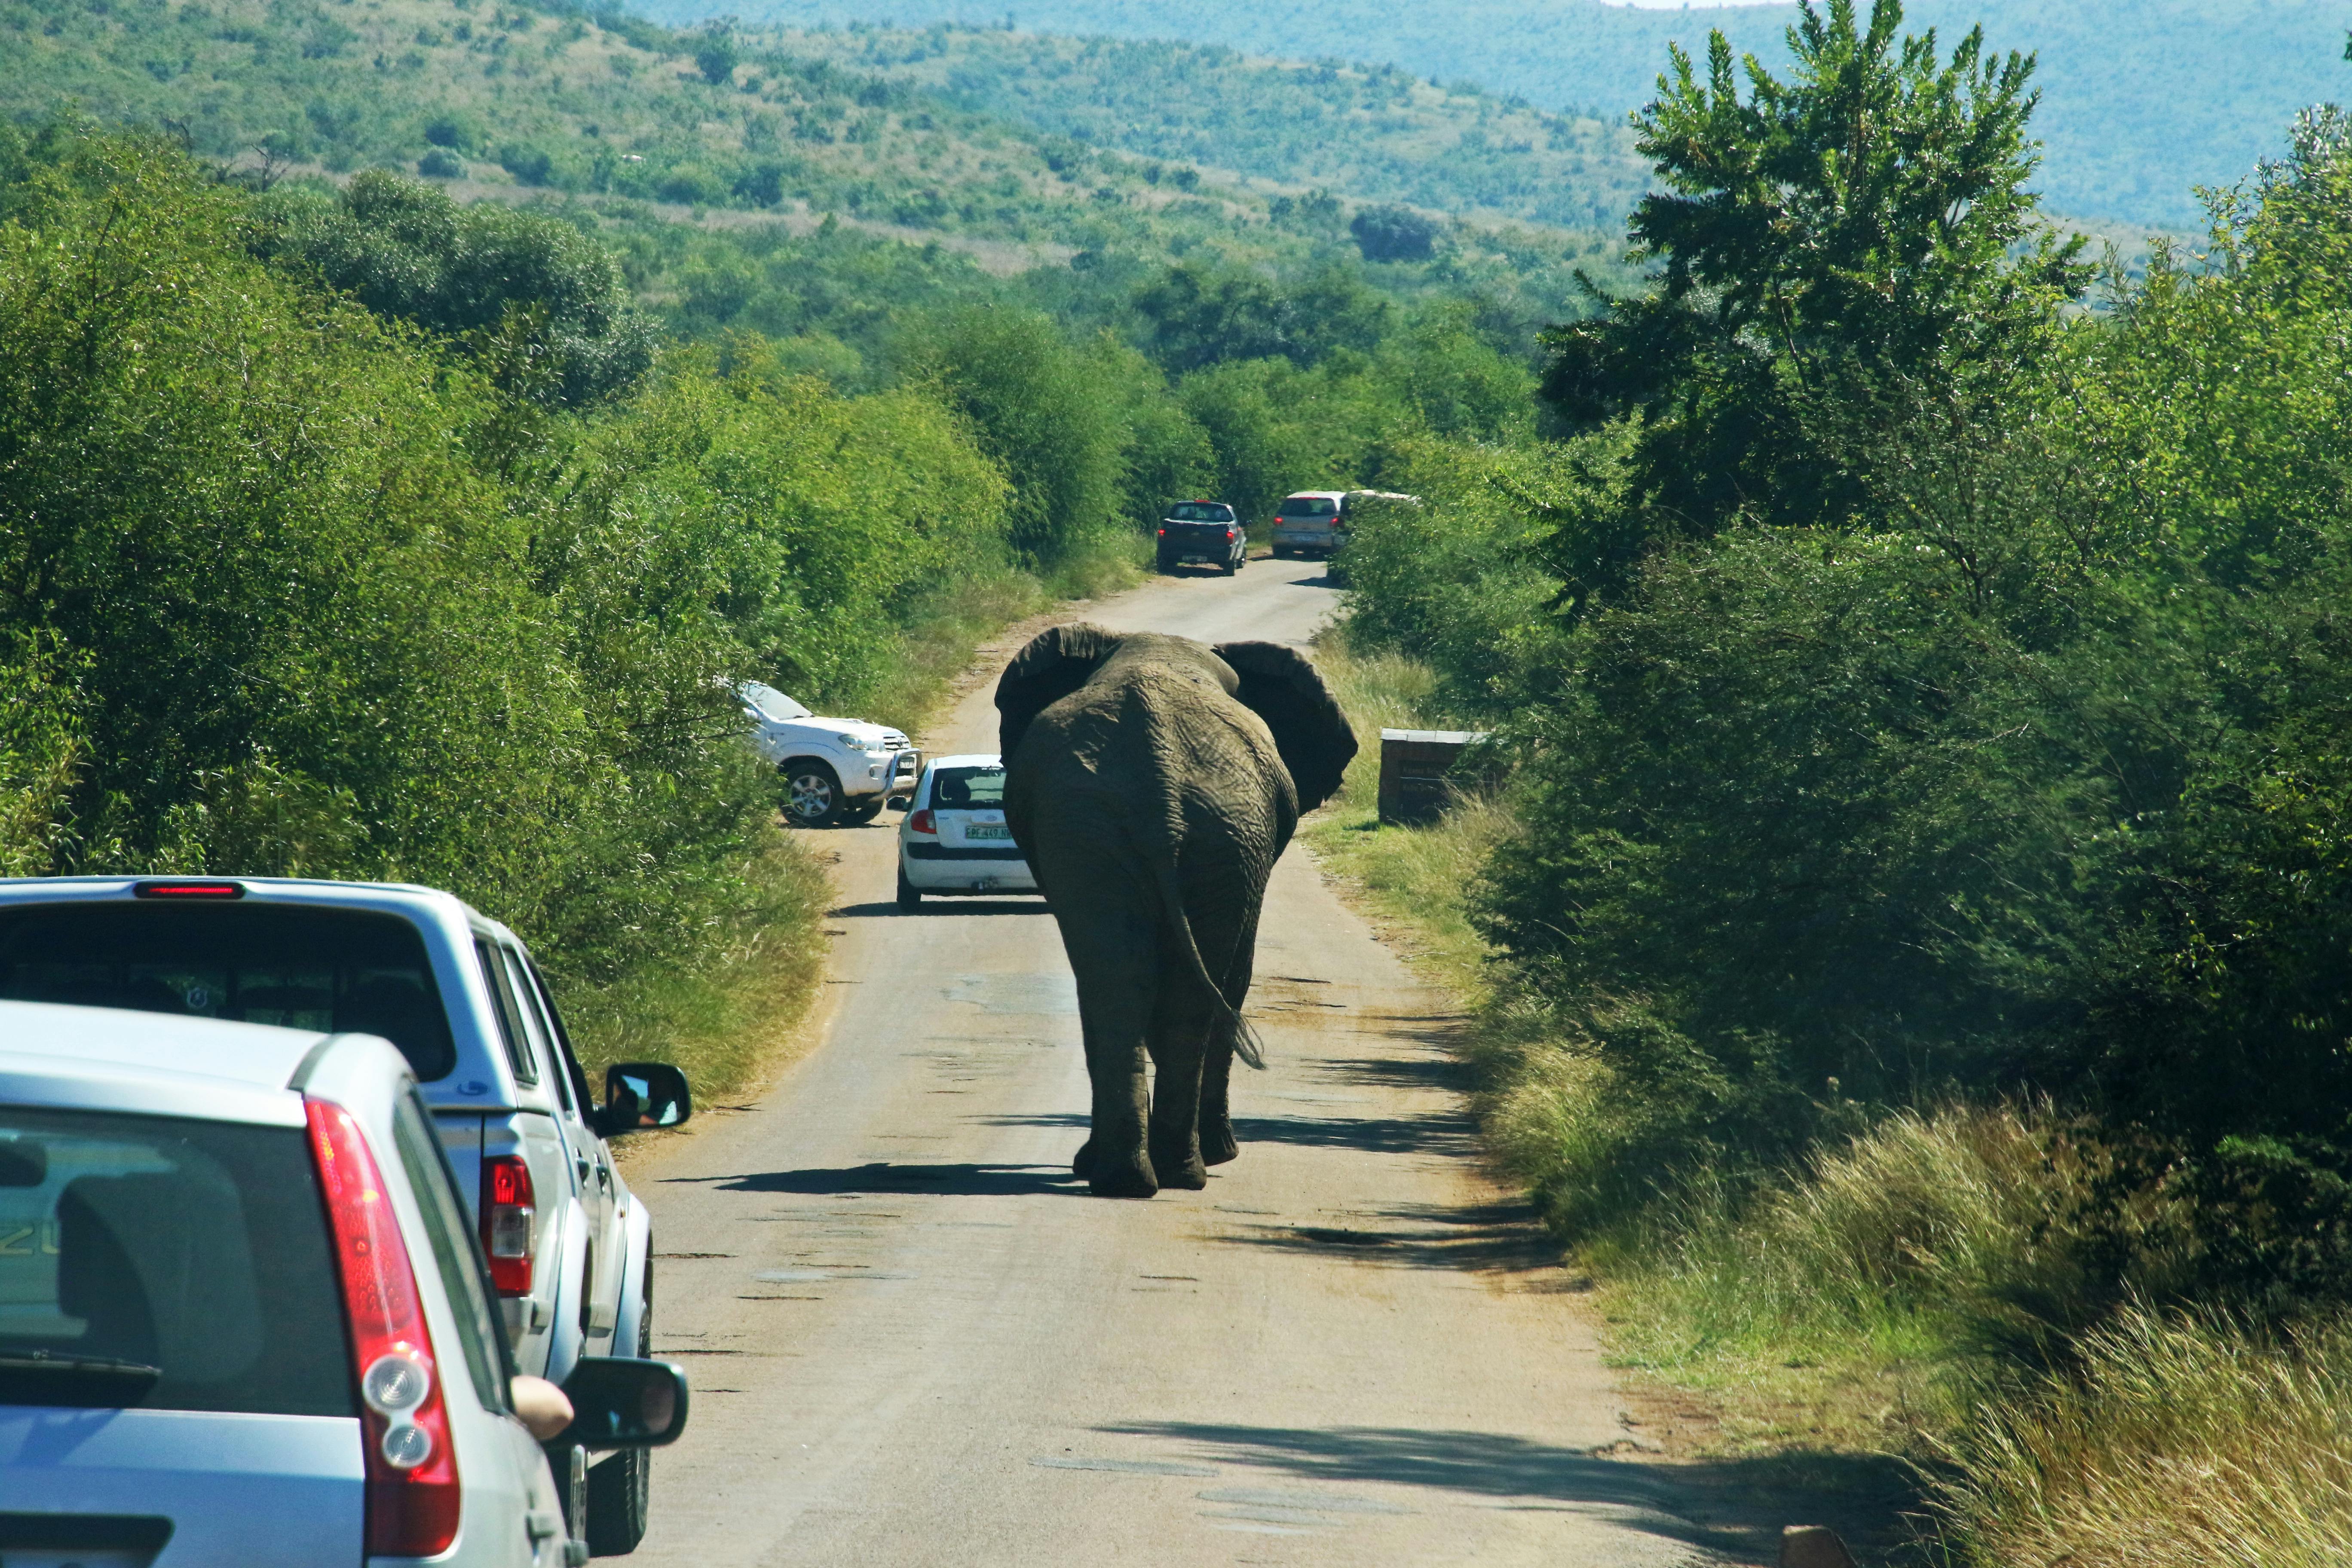
"Our safari in Kenya exceeded all expectations. EdgeWay's attention to detail and their partnerships with excellent lodges made this a trip of a lifetime."
"The culinary tour of Italy was exceptional. EdgeWay connected us with authentic experiences we never could have found on our own. Already planning our next trip with them!"

Download Full Performance Report
Access our comprehensive performance analysis with detailed metrics, trends, and insights to help plan your next journey with confidence.
